

To strengthen transparency and accountability, I designed and implemented a standardized Annual Reports system for Chippewas of the Thames First Nation (COTTFN). Prior to my redesign, department reports varied significantly in style and substance, lacking a cohesive structure for evaluation or comparison. I established a unified reporting format rooted in the Child-Centric Model — aligning each department’s work with the stages of life, prevention levels, and service categories.
Methods:
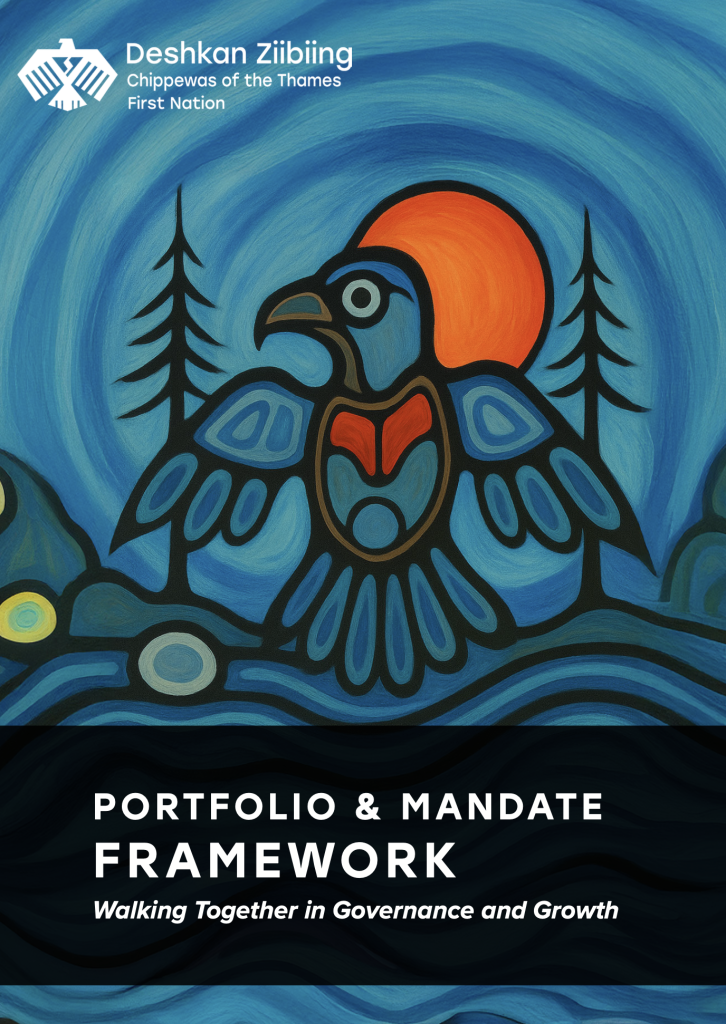
Designed a framework page and layout system linking department outcomes to COTTFN’s governance portfolios and the Portfolio & Mandate Framework vision of “Walking Together in Governance and Growth”.
Developed templates and visual standards for consistency across all departments, emphasizing accessibility, clarity, and evaluation readiness.
Transformed annual reports from static summaries into living planning tools, connecting program outcomes with Council mandate areas and funding priorities.
Integrated infographics, timeline visuals, and goal tracking to support both print and web publication.
Outcome:
The new system ensures continuity in reporting, helping departments plan strategically, evaluate progress, and align operations under shared governance goals. It also reduced editing time by 60% and improved community readability and engagement in official reports.
This project demonstrates the ability to synthesize complex departmental information into clear, accessible, and evaluation-driven public communications.
Overview:
Following extensive community engagement for the Big Bear Creek Trust, I designed the BBC Engagement Roll-Up report — a one-page infographic and summary that distilled input from 27% of COTTFN membership into actionable insights.
Design & Content:
Visualized data from community surveys and in-person sessions on communication, transparency, and trust.
Integrated key findings from “What Members Want to See” and “Communication & Transparency” sections — including requests for regular updates, plain language, and a central information hub (as shown in the engagement charts).
Crafted visual hierarchy to communicate results at a glance for leadership, staff, and the community.
Designed companion content for the Annual Report and Council presentation slides, supporting policy planning on communications and service delivery.
Outcome:
Insights from the Roll-Up directly informed improvements to communications, including multi-channel updates, website redevelopment, and the introduction of a Member Portal for verified access.
Demonstrates the ability to translate engagement outcomes into evidence-based planning and visual reporting tools that inform leadership decisions.
All reports and infographics were designed for cross-medium accessibility, ensuring readability across digital, print, and screen formats. Each portfolio within the report uses colour-coded identifiers, consistent iconography, and visual hierarchies optimized for assistive technology. Layouts follow WCAG 2.1 AA contrast standards and prioritize plain, readable typography for Elders and off-reserve members accessing materials via PDF or print. The modular structure enables future adaptability across publications and integration with web-based accessibility tools for the upcoming Member Portal.